![]()
Nowoczesna platforma do wizualizacji danych pochodzących z deszczomierzy, stacji meteorologicznych i hydrologicznych oraz innych urządzeń pomiarowych.
Dzięki niej można reagować na bieżąco na zmieniające się warunki pogodowe, optymalizować pracę zbiorników i minimalizować ryzyko podtopień. Z aplikacji korzysta już kilkadziesiąt miast i gmin.
Korzyści
- Aplikacja webowa dostępna w przeglądarce
- Możliwość prezentacji danych pochodzących z różnych urządzeń pomiarowych
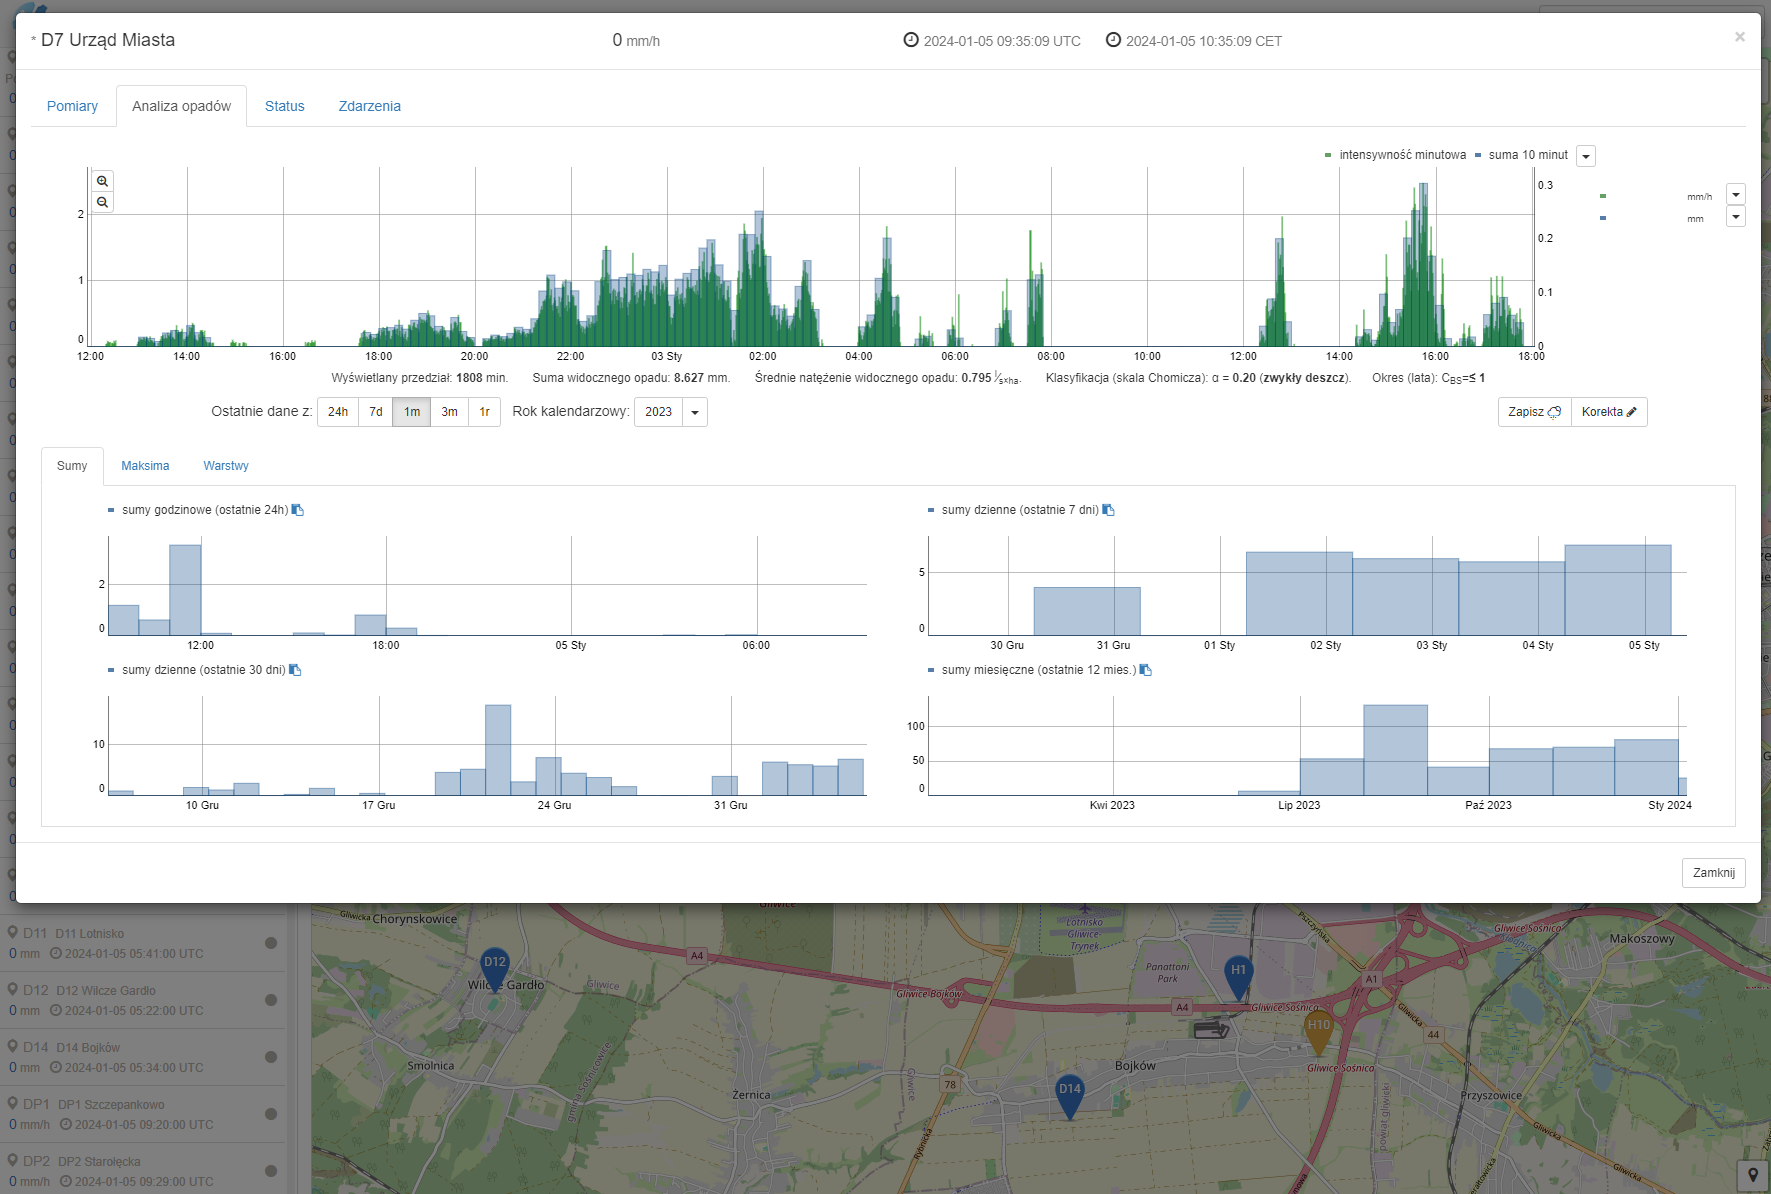
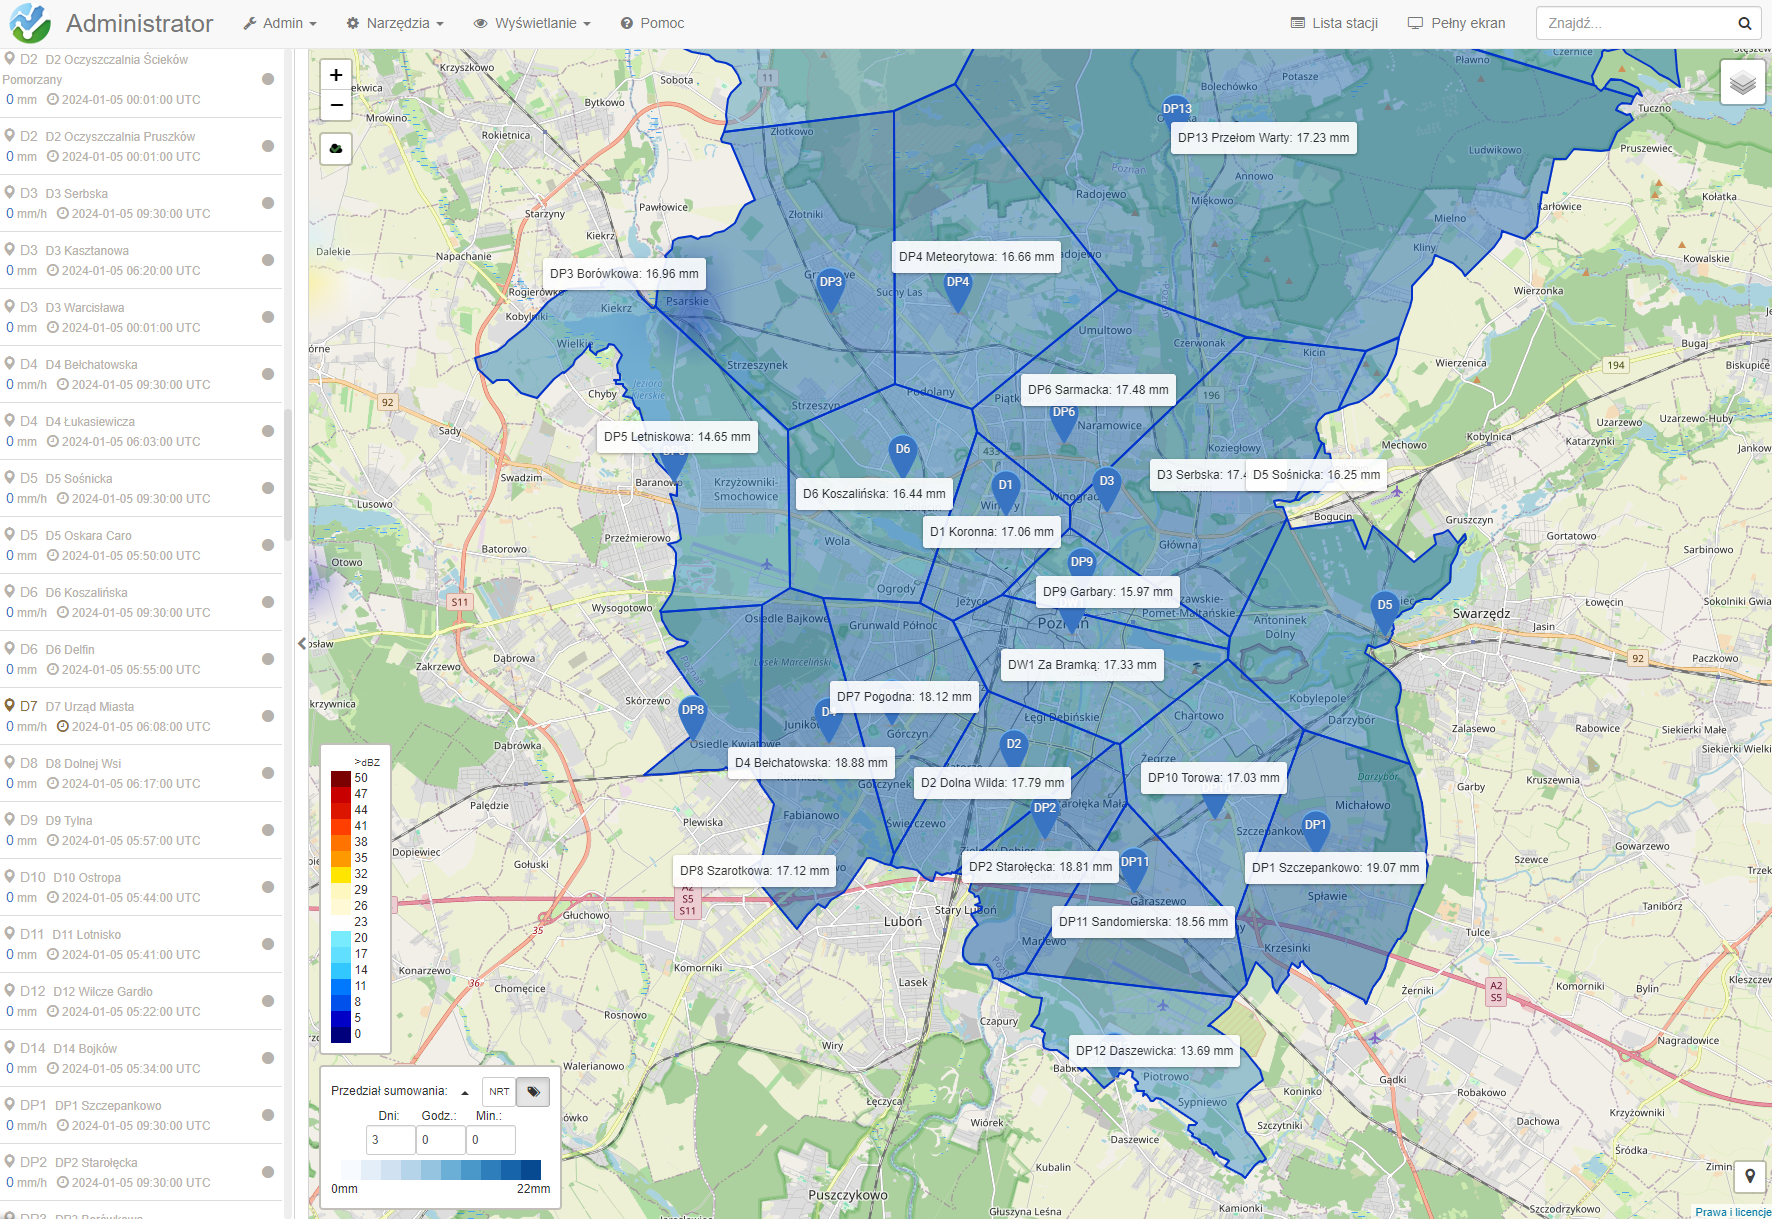
- Prezentacja danych o opadach w formie gotowych zestawień, analiz i raportów oraz rozkładu przestrzennego
- Jednolita baza danych o całej historii deszczów, stanów wód, pracy kanalizacji i innych mierzonych parametrów dla danej lokalizacji
- Zapewnia bezpieczeństwo gromadzonych danych
RainBrain umożliwia
- Szczegółową prezentacje i analizę danych
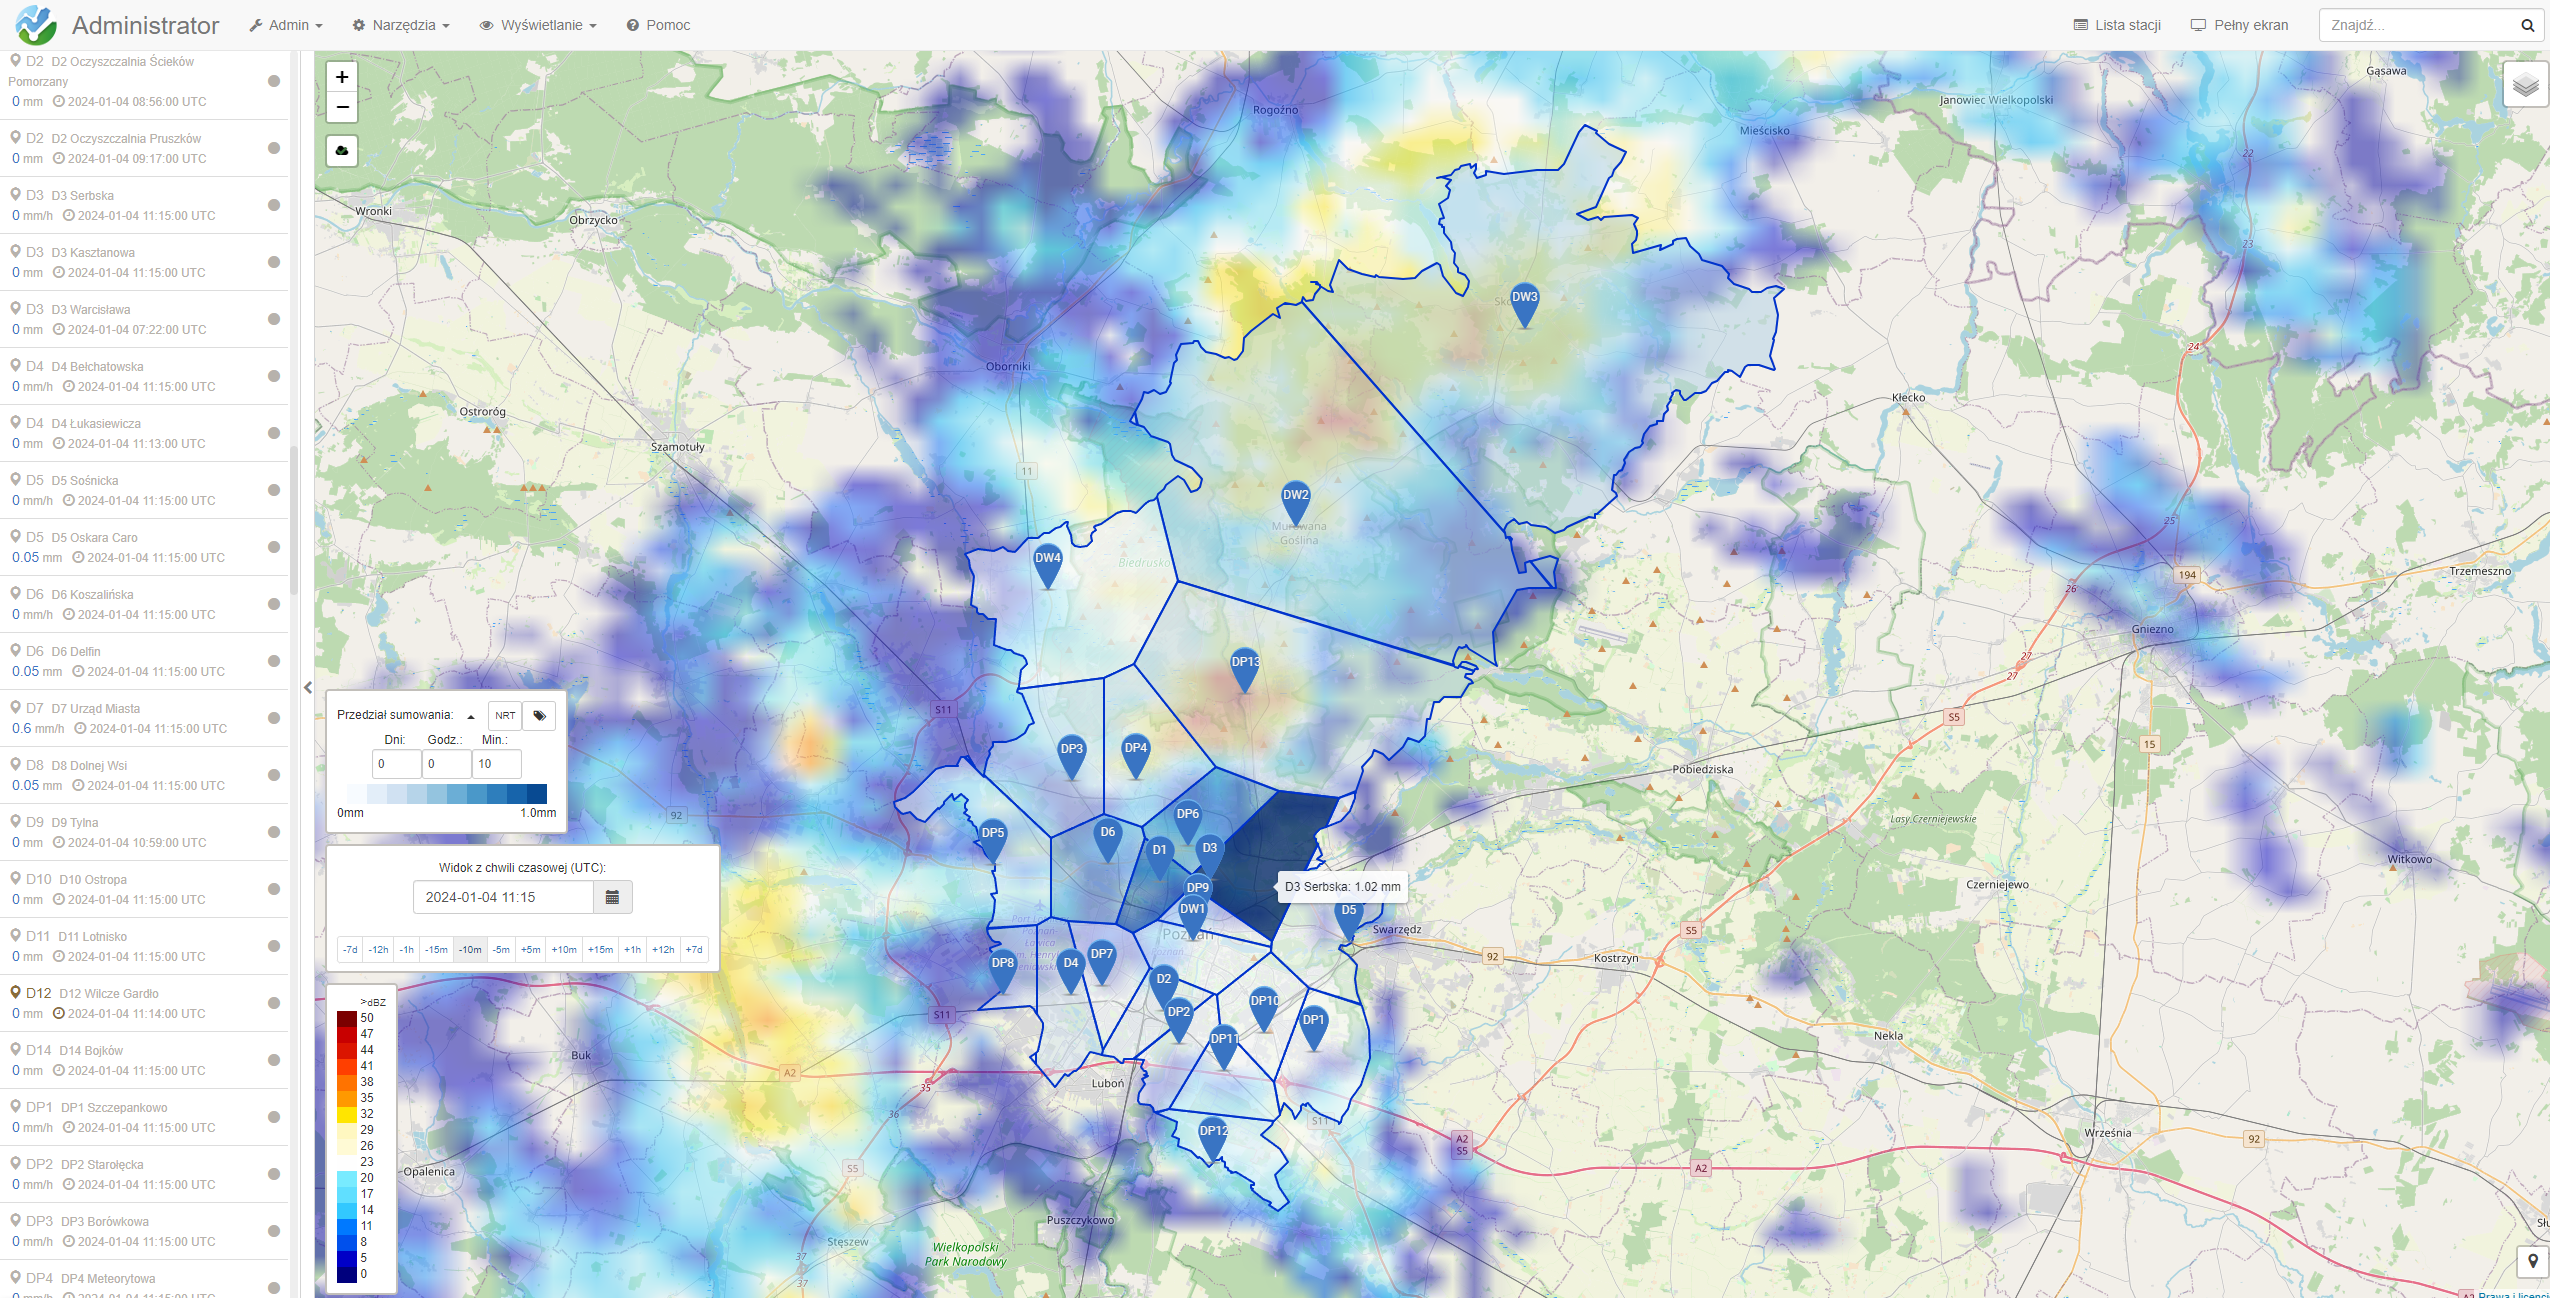
- Uzyskanie informacji na temat przestrzennego rozkładu opadu na terenie miasta
- Wsparcie przy podejmowaniu decyzji oraz planowanie inwestycji
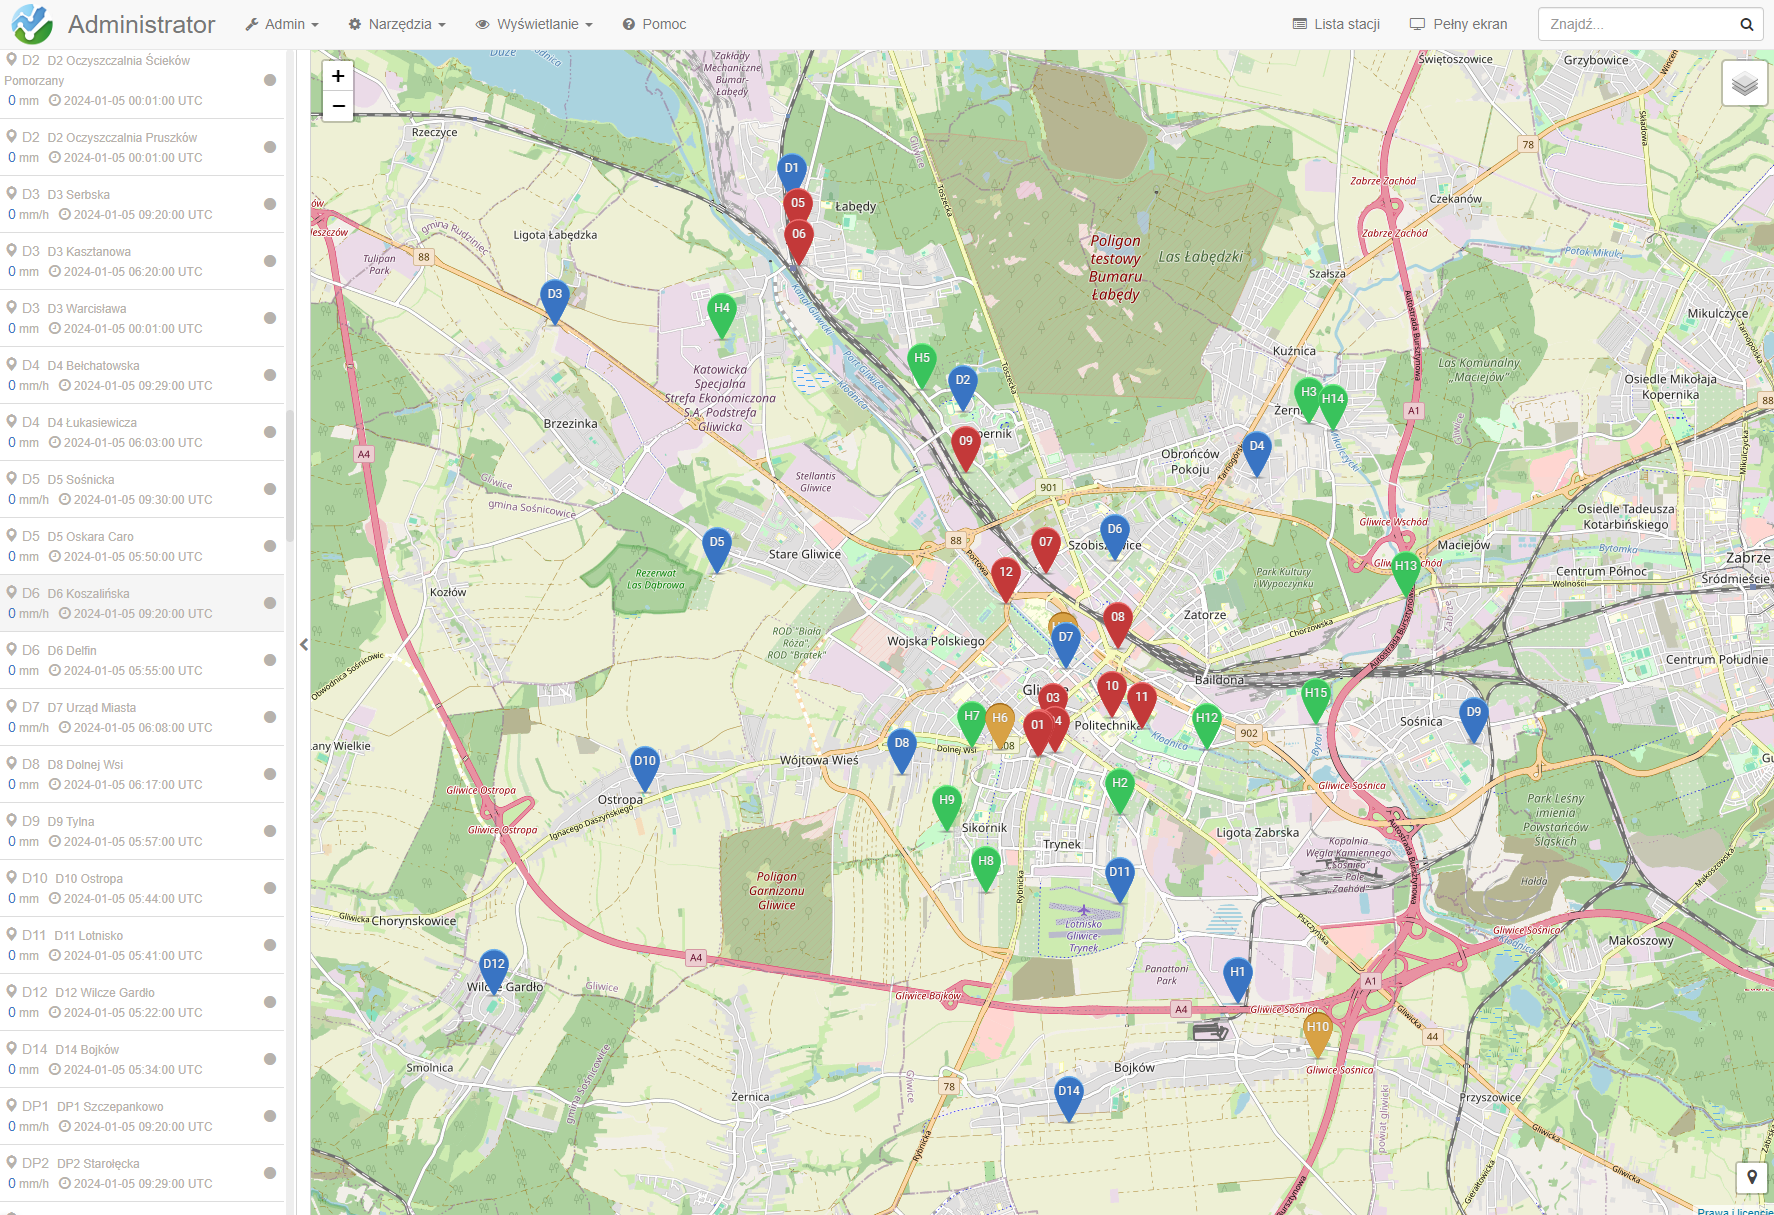
W aplikacji można wyświetlić wszystkie zintegrowane urządzenia hydrologiczno-meteorologiczne.
Dane pomiarowe z czujników różnego typu prezentowane są na przejrzystych wykresach ułatwiających ich analizę.
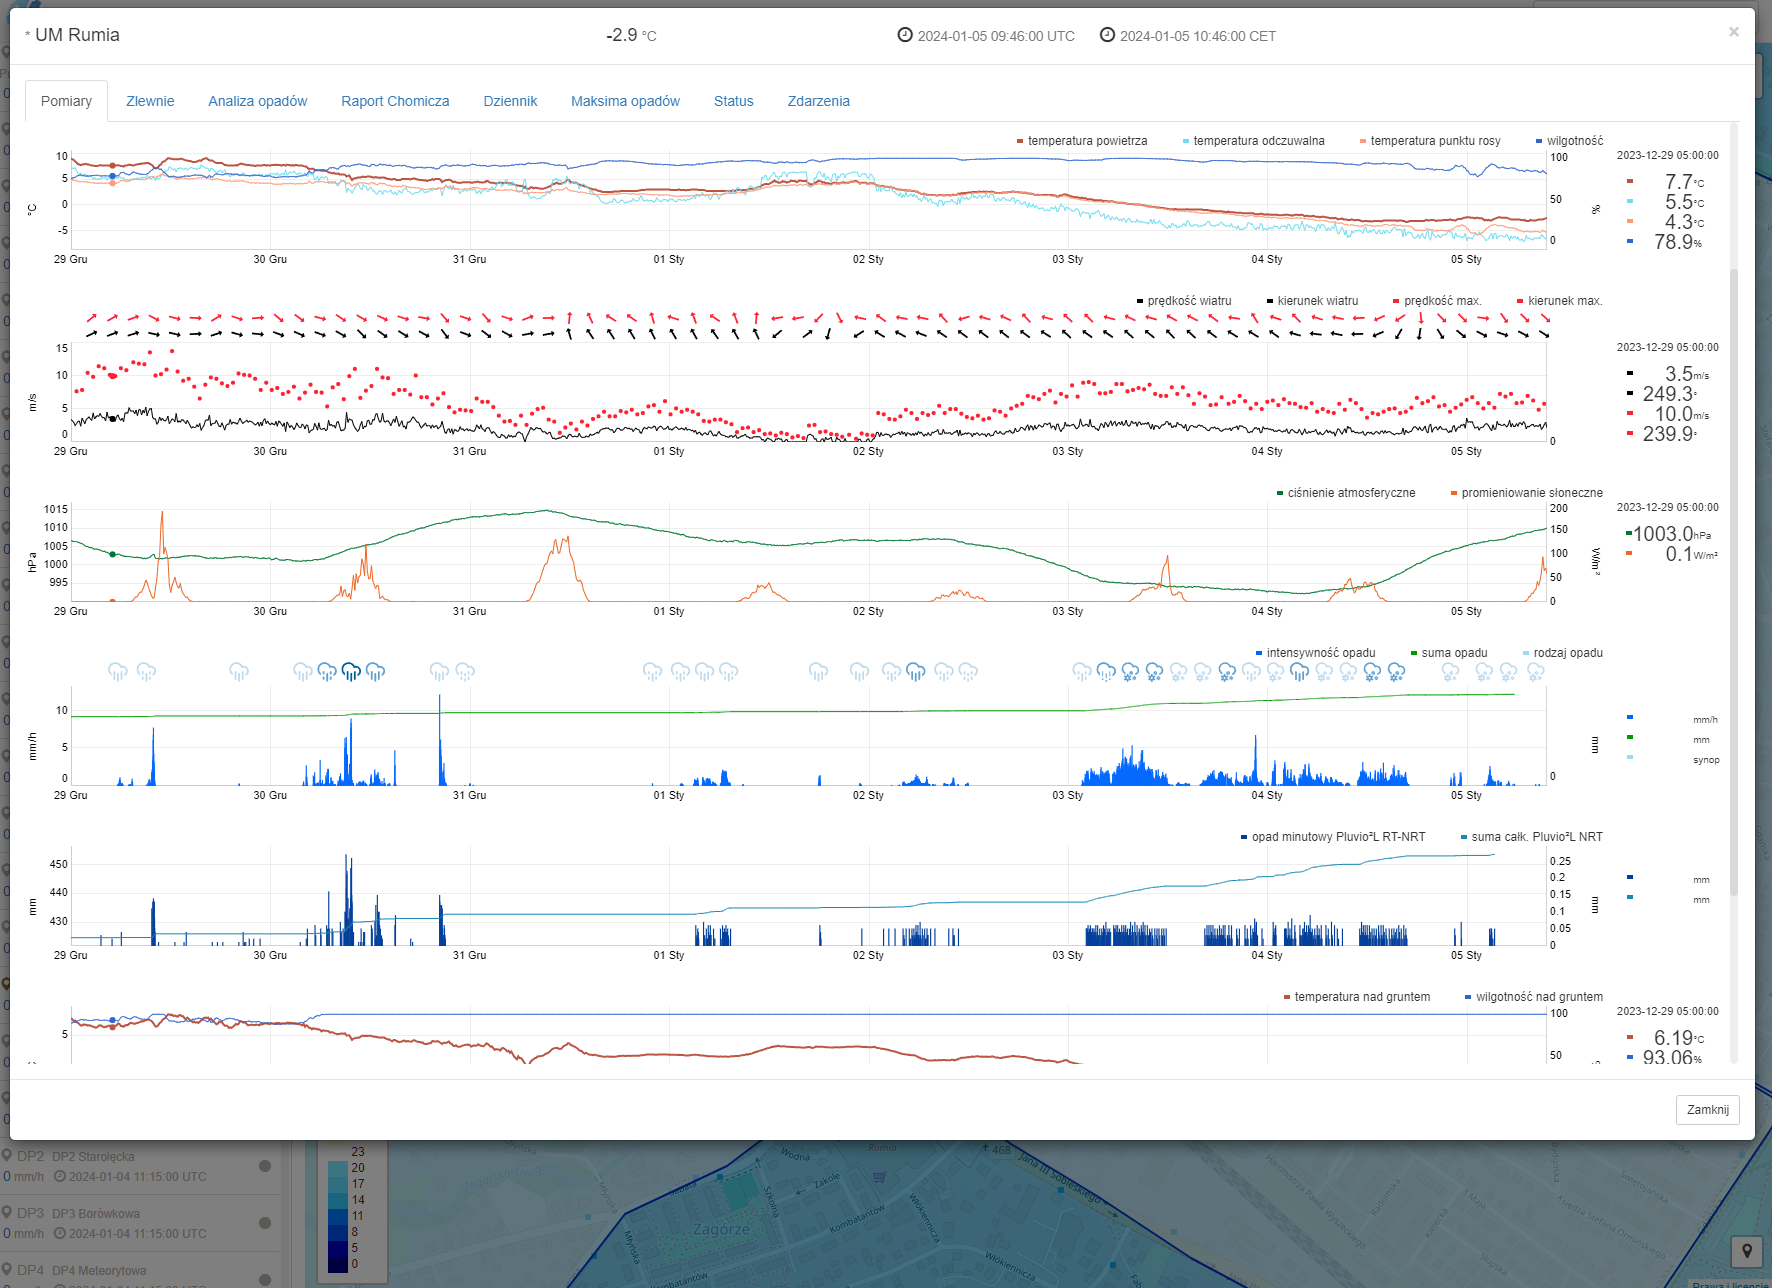
Prezentacja danych o opadach, w formie gotowych zestawień, ułatwia podejmowanie decyzji oraz planowanie inwestycji zarządzającym infrastruktura miasta.
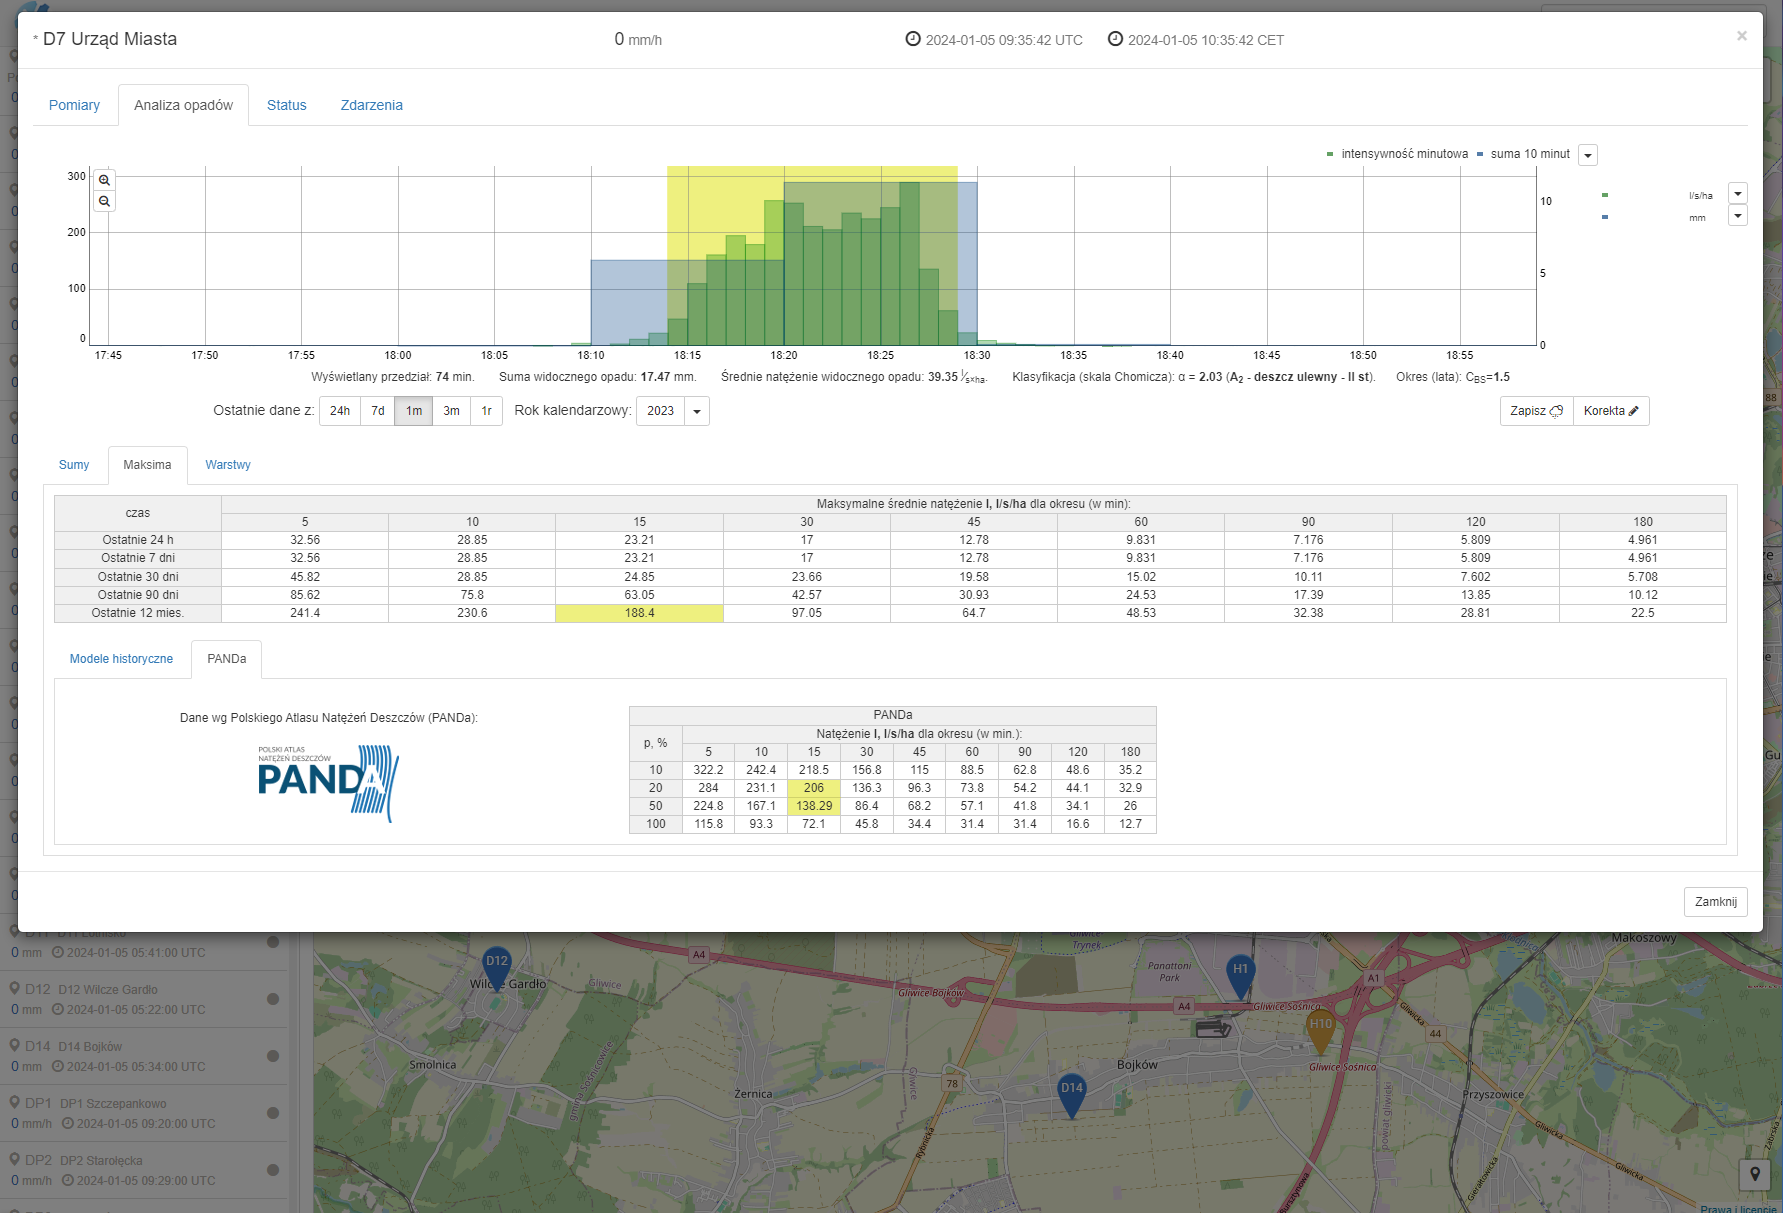
Dzięki połączeniu aplikacji z lokalnym modelem opadowym PANDa użytkownicy mogą w prosty sposób skategoryzować deszcze i określić ich stopień zagrożenia dla infrastruktury.
RainBrain umożliwia przestrzenne wizualizowanie aktualnych i historycznych danych opadowych na mapie miasta.
Aplikację RainBrain integrujemy z już istniejącymi czujnikami oraz dostarczamy w zestawie, instalując nasze urządzenia meteorologiczno-hydrologiczne.
Naszą aplikację wdrożyliśmy już w wielu miastach Polski, m.in.

Naszymi Klientami, oprócz miast i gmin, są także wodociągi, uczelnie, parki narodowe i instytucje.

Podłącz swoje urządzenia do aplikacji RainBrain i ciesz się łatwym dostępem do danych!


